Note
This blog post is inspired by Marcus Stade's presentation at MeasureCamp Madrid 2025. I definitely suggest you follow him and attend his sessions. And many thanks to David Vallejo and the team for organizing such a great event!
One step back - guys, I really recommend you join MeasureCamps. It’s so inspiring to learn, share, and be part of a community! And you know what? You could start talking with random people in the room about attribution, consent, server-side, even Dataform, and that’s absolutely legal!))
Prerequisites
- You should have a Google Cloud Project with billing enabled
- GA4 export should be enabled for this project, and you should have some data to play with
- You clicked one button in the GA4Dataform installer, and have freshly baked output tables with sessions and events. In the next steps, I will use
ga4_sessionsandga4_transactionstables from the GA4Dataform package.
Disclaimer
It’s not a BigQuery or Dataform intro. I’m expecting you’ve already had the pleasure to complete Simo and Johan's course about BigQuery and Krisz's videos about Dataform. So it’s not like a beginner’s guide. And that’s definitely not a data science or marketing paper on how to use K-means and RFM. It’s more like a GA4 Dataform usage example with small tips and tricks all around the code. I hope this type of step-by-step guide could be interesting for those who have already learned Dataform basics and now want to play with some use cases.
Plan
- Few words about RFM
- Few words about K-means
- GA4Dataform package folder structure
- Input table for the model
- Model and output table
- Dataform and Notebooks
Few words about RFM
Marcus did a great intro about the method - you could find details in his slides.
In short, this is the old-school but still working-fine algorithm to split the audience based on their purchases: last time purchase (R - recency), how many purchases (F - frequency), total value (M - monetary). After we add RFM labels for each client, we could create segments and target different messages to different groups. Or, in a slightly more advanced case, target users who are migrating from segment to segment.
Few words about K-means
For clustering we would use a rather standard K-means algorithm. Again, please read Marcus’s slides with the description. In the scope of the current blog post, it’s only important that BigQuery ML provides the implementation, and we will try to use it.
GA4Dataform package folder structure
We are going to create a table with RFM values for each user_pseudo_id. But before showing you the code, a few things about the GA4Dataform package. By design, it provides two folders:
- core
- custom
And all your code, models, and so on must be put in custom. Otherwise, you could lose them during the package update. The installer deletes everything in core and doesn’t touch the custom folder.
That’s why the folder structure for the solution could be like this:
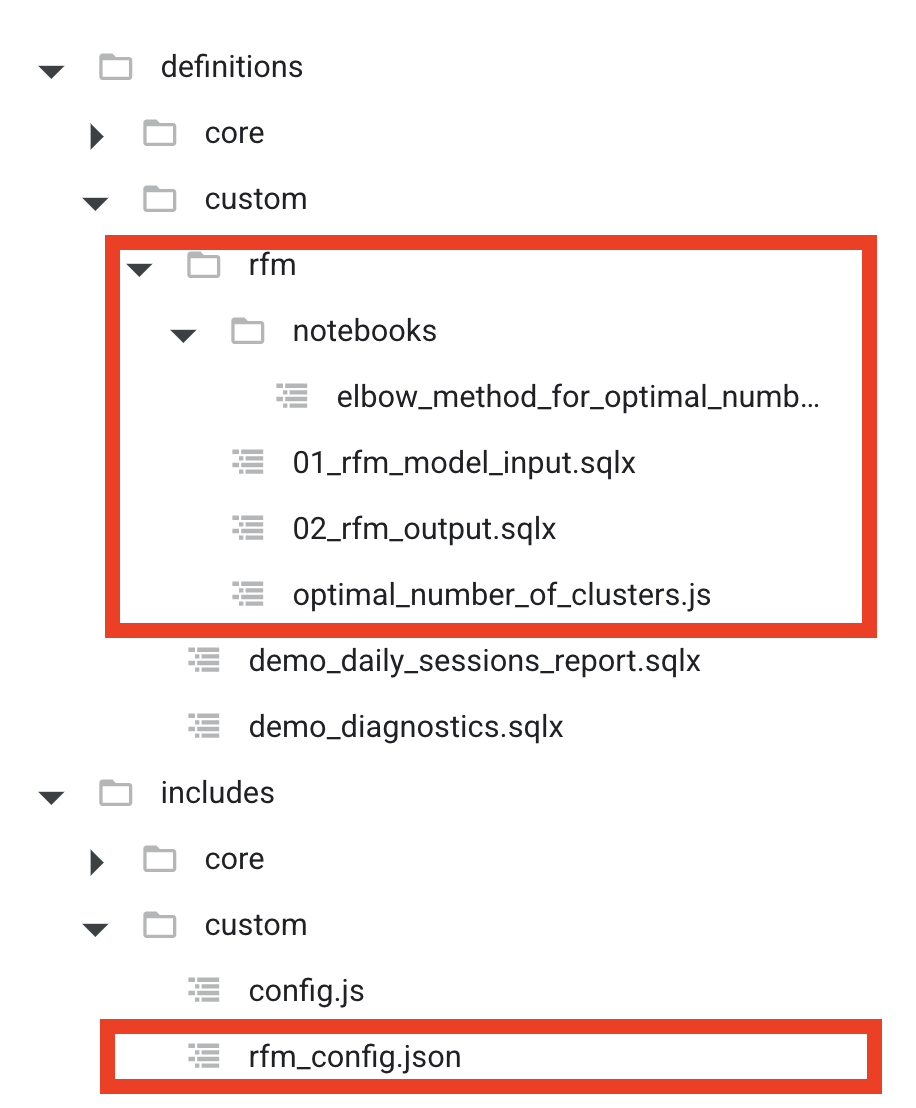
in definitions/custom/rfm:
- 01_rfm_model_input.sqlx - input table model
- 02_rfm_output.sqlx - K-means model
- optimal_number_of_clusters.js - notebook definition
- notebooks/elbow_method_for_optimal_number_of_clusters.ipynb - notebook code
in includes/custom
- rfm_config.json - config with RFM model parameters
Input table for the model
Ok let’s have a look at the first model that prepares a table with RFM values for each user 01_rfm_model_input.sqlx:
| |
Let’s go through the code and point out some interesting parts:
Dataset definition
| |
Here we define a dataset for our custom model. I decided to keep it separate from the main models but reuse the existing compilation variable OUTPUTS_DATASET. This variable is created during the package installation. You can find it in the workflow_settings.yaml file in vars.
Labels
| |
Labels are needed to build reports to control execution and storage costs. You can read Simon's great article about them. In the next package version, I promise, there will be an easier way to add custom labels.
Configs and helpers
| |
In the js block you can define your JavaScript helper methods and constants. Because in the package, all JavaScript helpers are saved not in the root directory but in core and custom subfolders, we have to import them manually.
I didn’t find in the official documentation how to import JSON files but it’s really simple - just require them:
| |
And rfm_config.json is a simple JSON file that contains the RFM settings:
{
    "numClusters": 3,
    "rebuildModel": true,
    "modelVersion": "version1",
    "lookBackWindowMonths": 0
}
Declares SQL variables
Next we have a pre_operations block to define the max date of sessions from the ga4_sessions table. We need this to calculate recency based on the last existing date.
The model itself is very basic - we just calculate RFM metrics for each user_pseudo_id based on the ga4_transactions table.
Maybe one comment about this line:
| |
This is a dynamic part of the code based on rfm_config.json. The idea behind this is that sometimes you don’t want to calculate RFM for all available dates but only for some range, like the last year. So you can update lookBackWindowMonths in the config and the model will query only this number of the last months.
Model and output table
The next step is the model - 02_rfm_output.sqlx
| |
Ok, let’s dive in. First of all, I decided to keep the model as an incremental type. I want to have a history of each execution to compare models with different parameters. But also to detect changes in RFM segments, like all users who moved from the ‘Whales’ segment to the ‘Dead’ segment.
The code consists of a two-part pre_operation block with model creation and the main part where we run the PREDICT method of the model to get segments for each user.
Model creation
Documentation of BigQuery ML K-means model
| |
Based on the rebuildModel parameter, the code will either rebuild the model for each execution or just use an already existing model.
getModelName() helps to generate a model name with dataset and version from rfm_config.json. If later you build a new version of the model, you will have two models and can compare their results.
Number of clusters
The most important parameter of k-means models is the number of clusters.
| |
For RFM analysis Marcus suggested starting with 3 or 4 clusters (num_clusters parameter). Otherwise it will be difficult to interpret the clusters. But we will discuss this topic later in the post.
Model query statement
And another really important part of the model creation is the select statement.
| |
We exclude user_pseudo_id because it’s a random string (and Google likes to make it more random from time to time changing the format) and we don’t need to cluster the distribution of user_pseudo_id.
And secondly always try to use the simplest possible select statement in the model creation. Even if you need to join or filter - make all these changes in the previous steps because the pricing of BigQuery ML is higher than usual select statements.
Predict segment
Ok the model is created and now we can predict the segment for each user.
| |
As you can see, we select FROM ML.PREDICT to get prediction results, but because we excluded user_pseudo_id from the model, we also add select statement (select * from ${ref('01_rfm_model_input')}) to add user_pseudo_id back to the final table.
And just for logging I also add these columns:
- predict_date
- num_clusters
- model_version
You could also open the model’s Evaluation tab in BigQuery UI, to understand the meaning of each segment
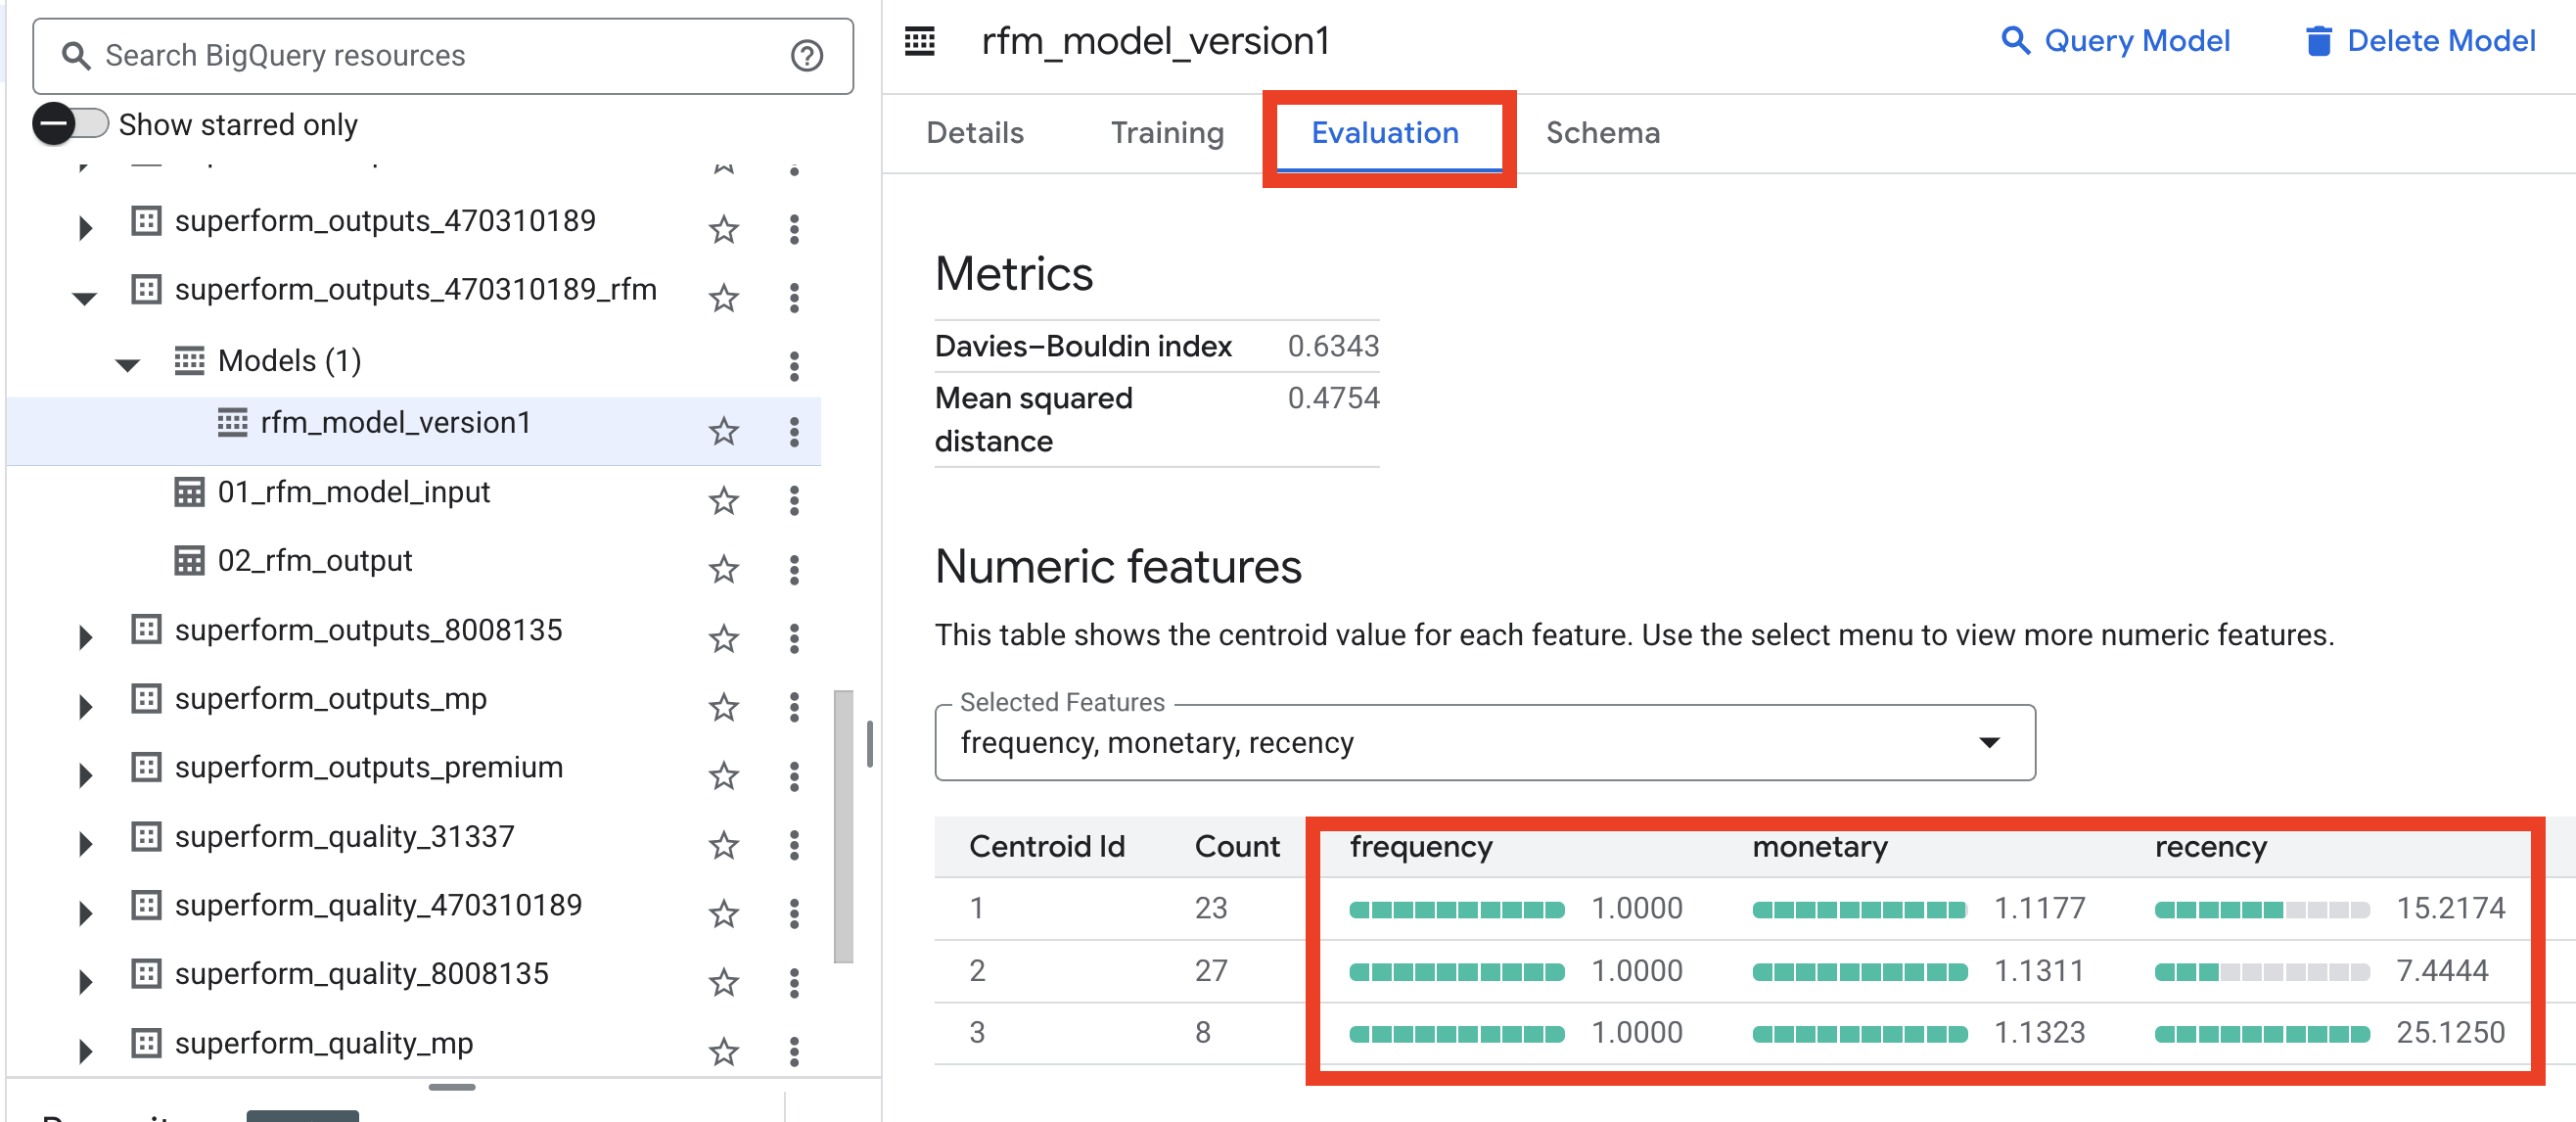
In my tets dataset I don’t have to much purchases so difference only in recency - but usually you could notice “Whales”, “Dolphins” and other “Non-fish-vegan” segments.
Create Notebook
And the final part of the post is about Notebooks. In the source code I saw that Dataform supports Notebooks. But there’s no official documentation about it. In the GitHub code I found test projects and try to execute it, but I can’t find information about required permissions. So I started randomly adding everything to find a working combination. But no luck. At the end I messaged Pia Riachi (I really recommend following her on LinkedIn and of course checking her Dataform repository), and she pointed me in the right direction.
At the moment you can’t really develop Notebooks in the Dataform UI but you can run Notebooks as part of your pipeline.
The current flow could be:
- Create a Notebook in BigQuery, test everything
- Download Notebook and copy the code into Dataform
Why should you do this? Maybe you like Dataform and want a more nerdy way to do simple things or for a boring pragmatic reason - if you need to run a Notebook after some dependency. For example, you want to run your Python churn model as soon as GA4 data is ready.
In the context of the RFM example, let’s assume we want to run some Python code to find the optimal number of clusters for our dataset. Of course, we don’t need to do it after each run, but that’s ok it’s just an example.
I picked the first blog post on the topic with the simplest Elbow Method. I used the Python code from this post, so all kudos to Alfonso Cervantes Barragan.
Create BigQuery Notebook
The first step is to test everything in BigQuery Notebooks.
Create a new file elbow_method_for_optimal_umber_of_clusters
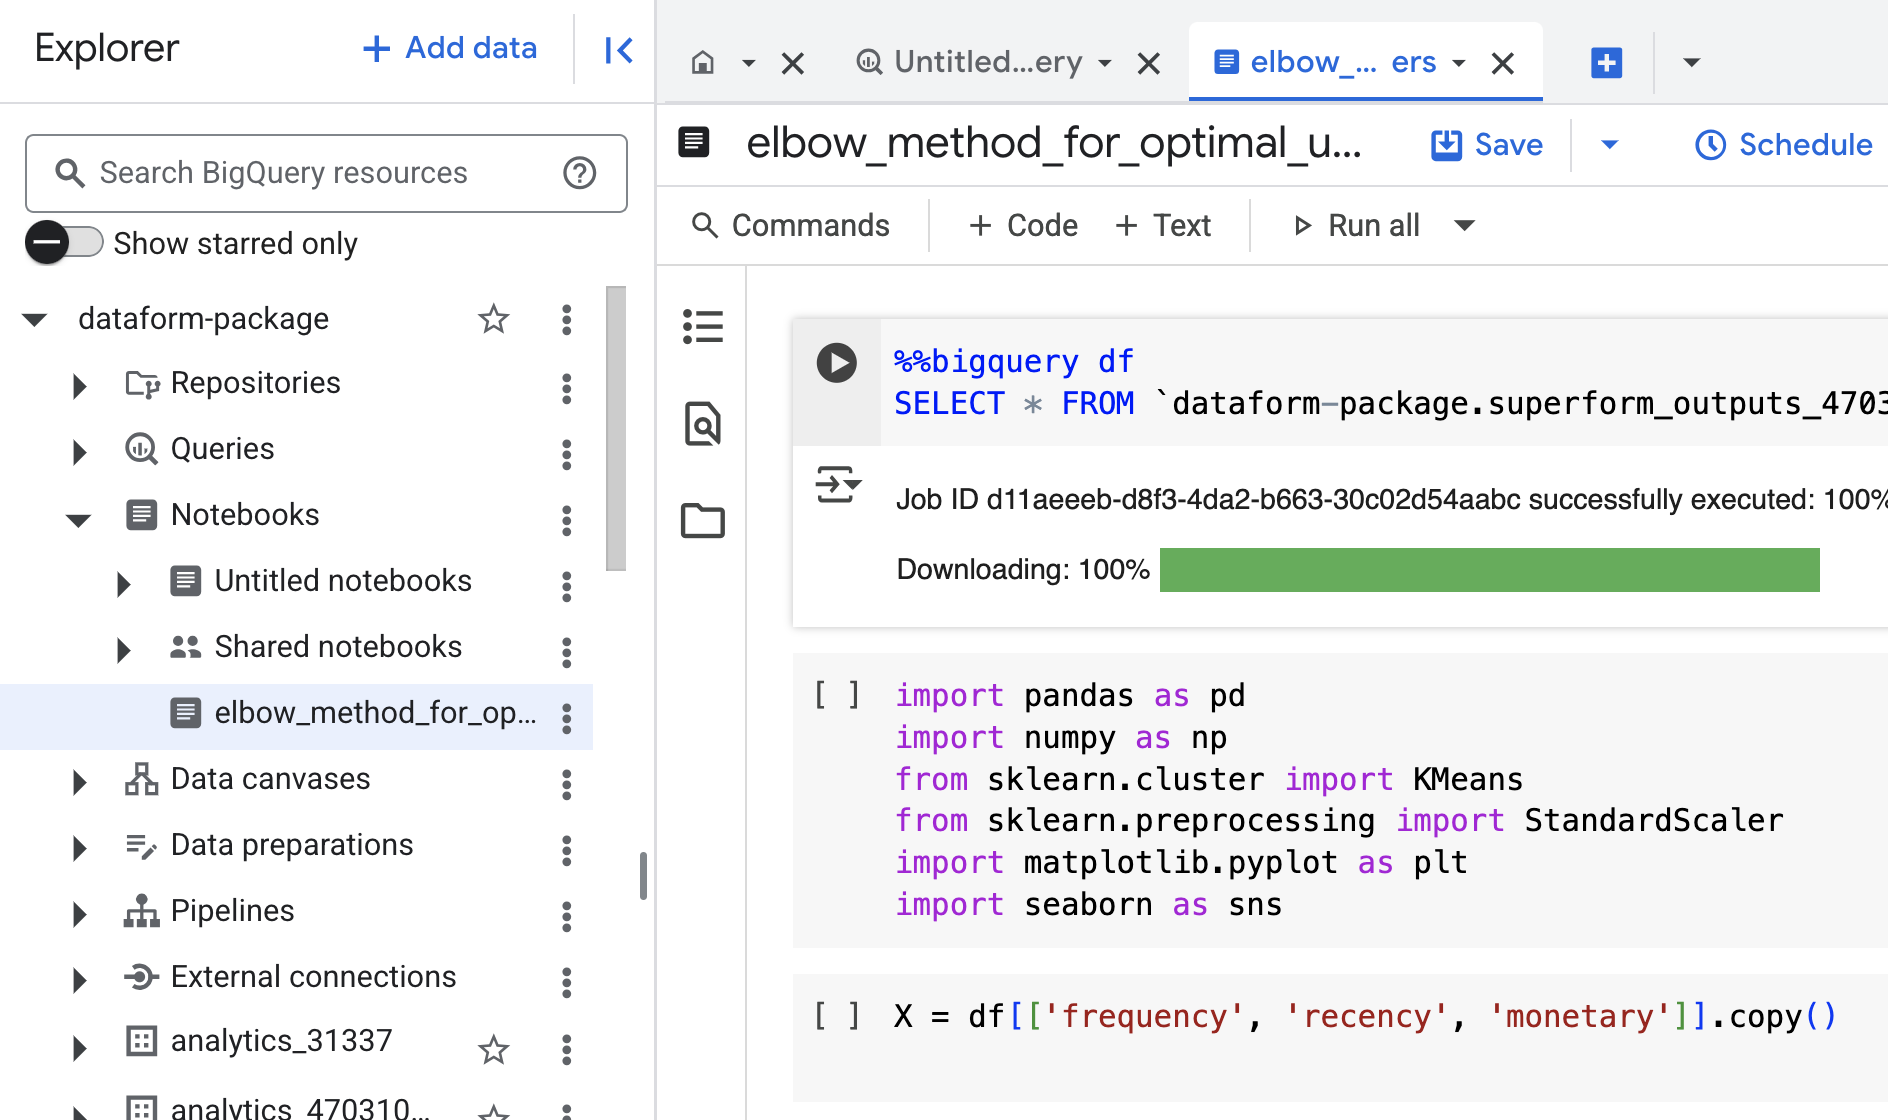
With code:
| |
Change rfm_model_input to the input model table from previous step. Execute the code, and you should see something like this:
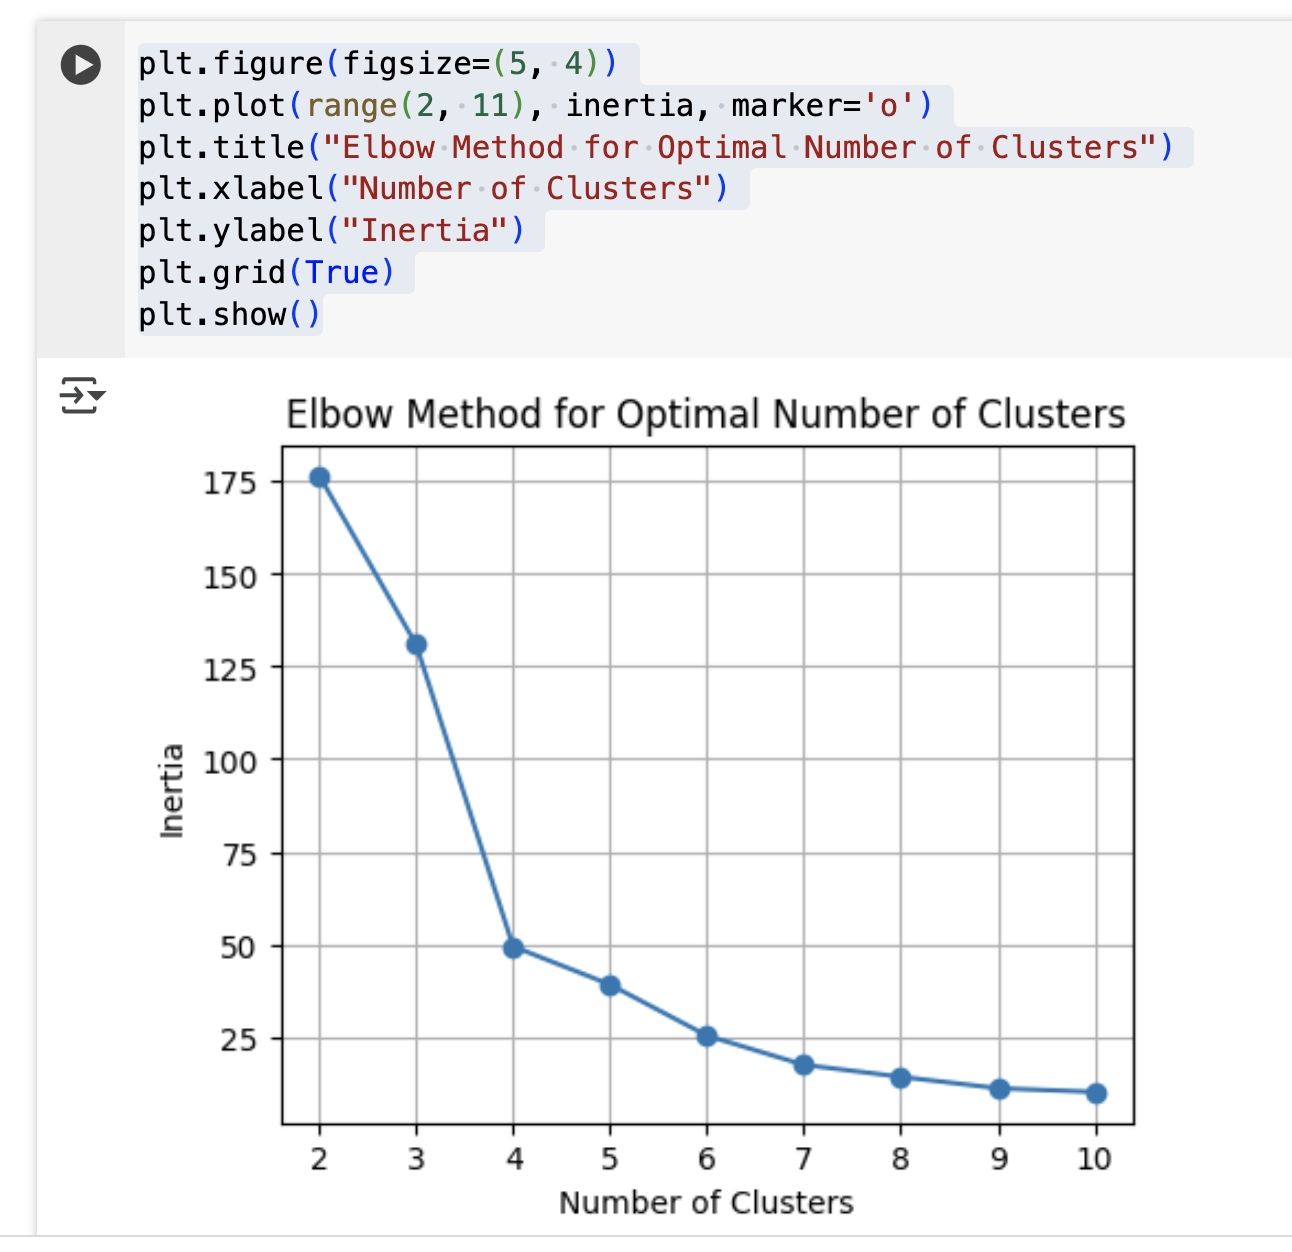
It means for my dataset it’s better to use 4 clusters. Great! So we have a notebook example and now we want to run it in Dataform.
Service account with permissions
Next step: create service account with needed permissions. Thanks to Pia again! Here’s a link to BigQuery Notebook Scheduling documentation
So we go to IAM / Service accounts and create a new one (for example dataform-notebooks@dataform-package.iam.gserviceaccount.com) with these roles:
- BigQuery Data Editor
- BigQuery Data Viewer
- BigQuery Job User
- BigQuery Read Session User
- BigQuery Studio User
- Dataform Admin
- Notebook Executor User
- Service Account Token Creator
- Service Account User
- Storage Admin
Bucket for Notebook results
Next step - we have to create a Cloud Storage bucket for Notebook results. Let’s name it your_project-notebooks and create it in the same location as your RFM dataset.
Notebook in Dataform
And now we are ready for Dataform part.
Create these files in definitions/custom/rfm:
- optimal_number_of_clusters.js - notebook definition
- notebooks/elbow_method_for_optimal_number_of_clusters.ipynb - notebook code
Download Notebook content from the BigQuery and save the code in notebooks/elbow_method_for_optimal_number_of_clusters.ipynb
And add this code in optimal_number_of_clusters.js:
| |
For real use cases you could add tags and dependency in the configuration.
And the last step - update workflow_settings.yaml with bucket path like this:
defaultNotebookRuntimeOptions:
 outputBucket: gs://<you_project>-notebooks
Run Notebook
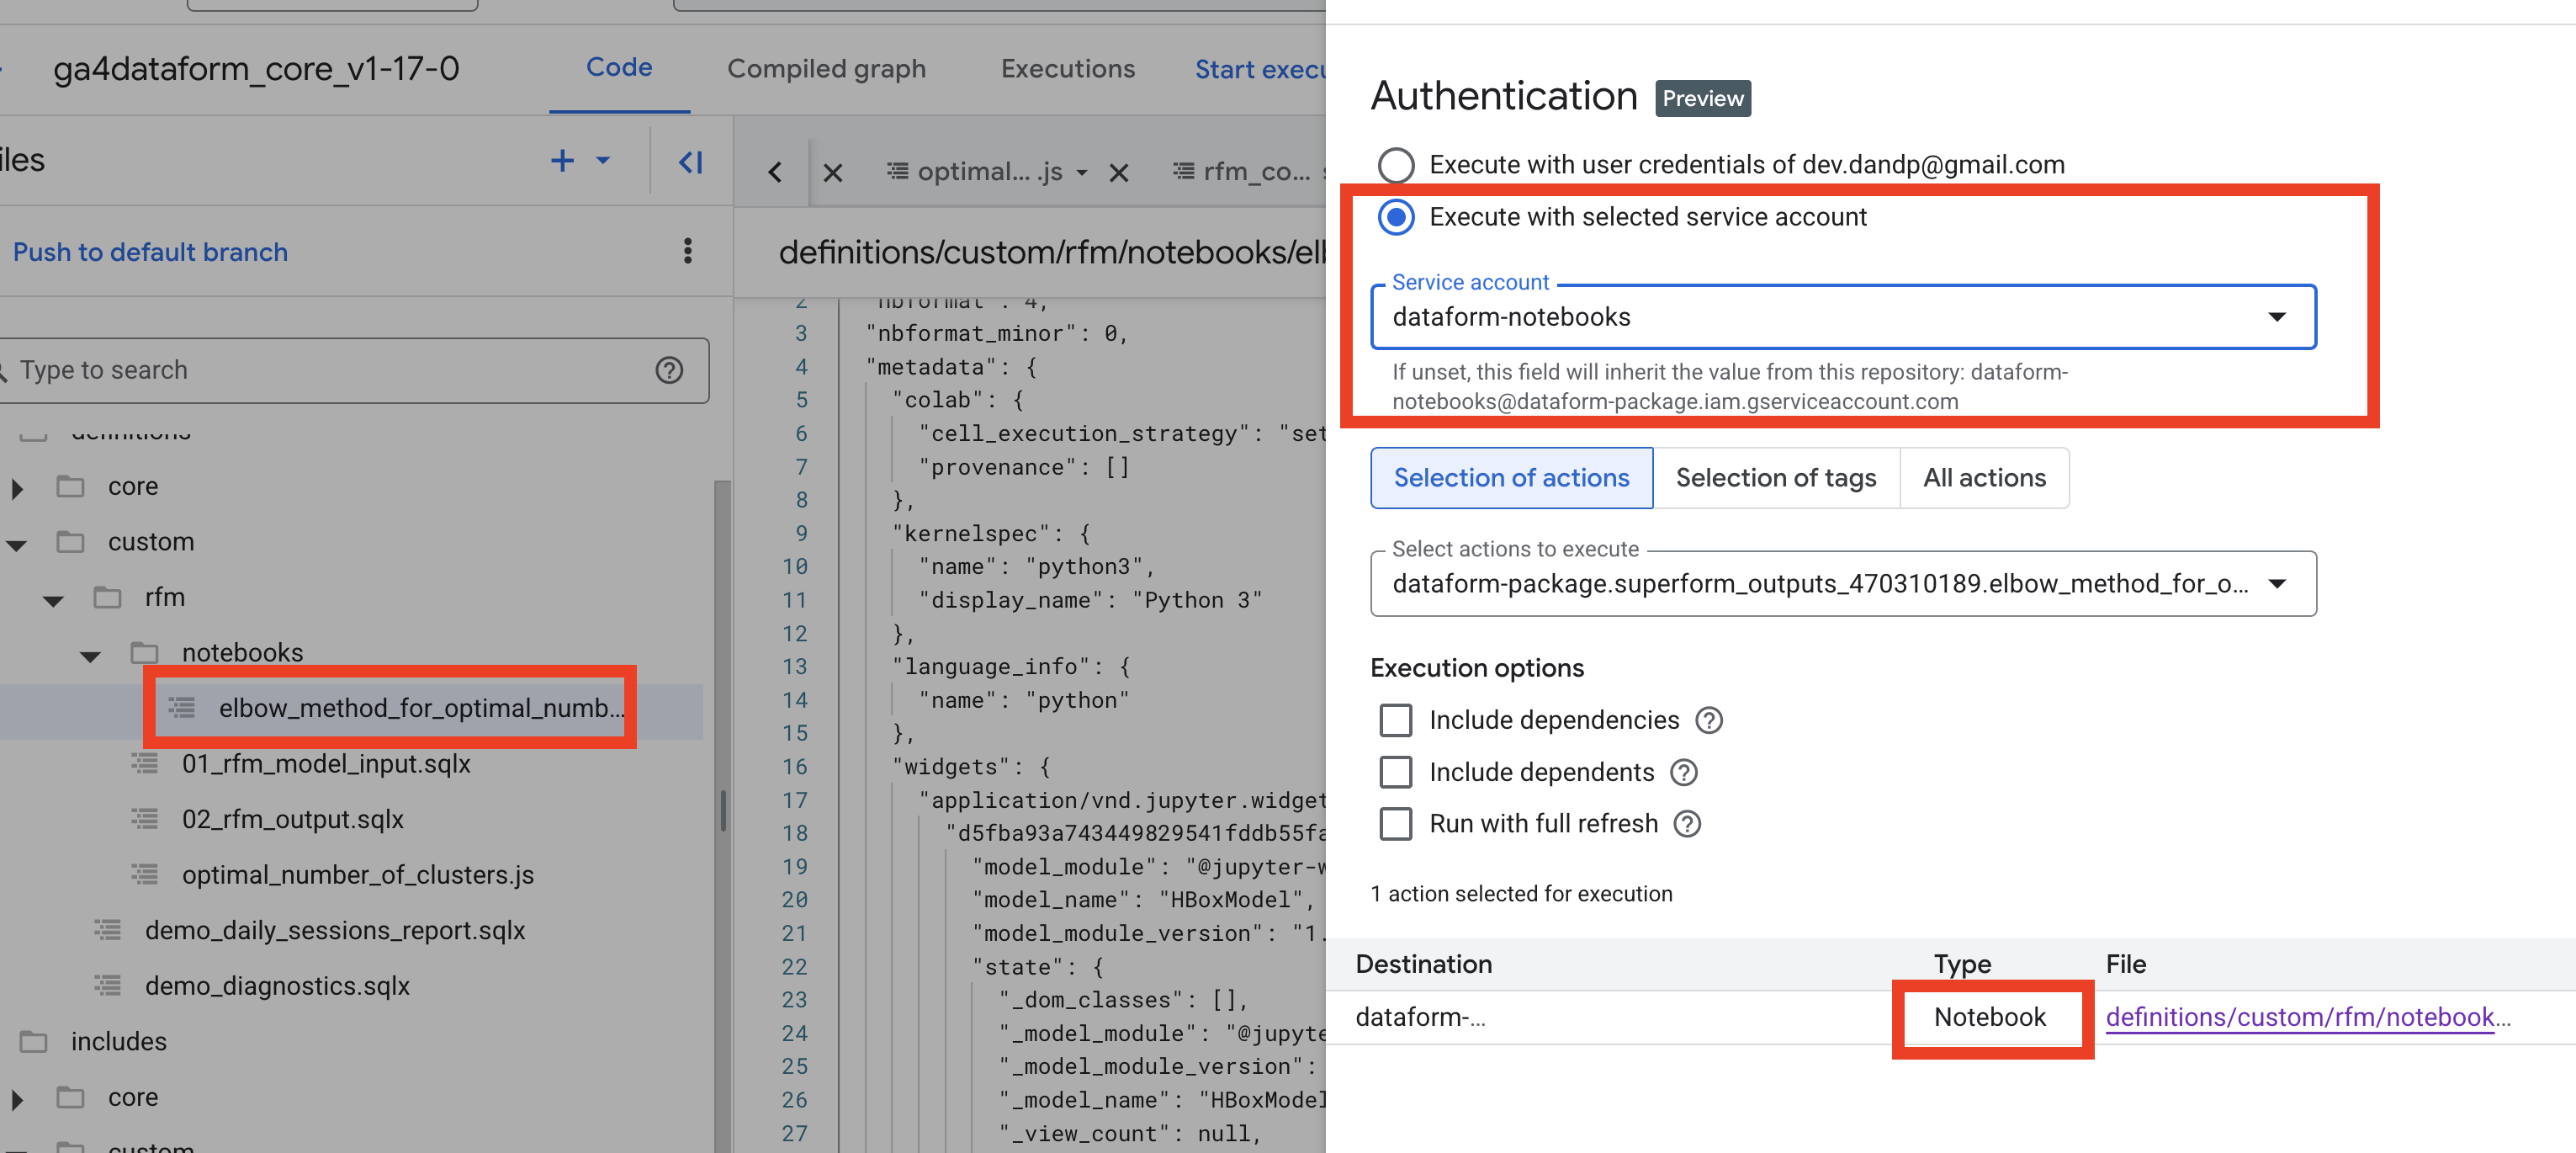
Select the notebook file and execute the action with the right service account:
After the execution is completed check the result in the bucket. You should see two files:
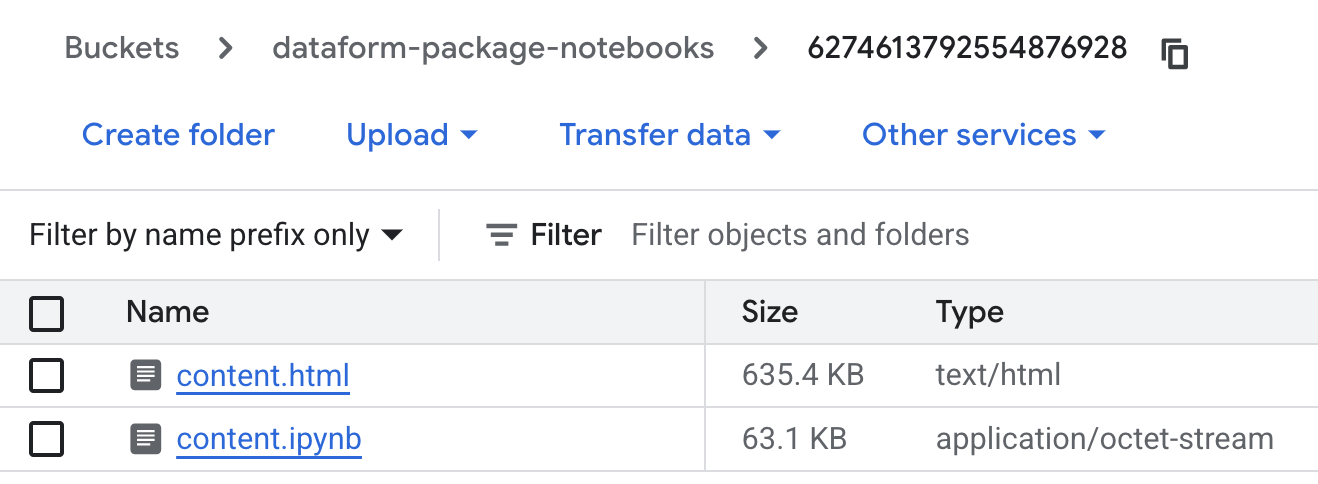
And content.html should contain the same plot as on BigQuery Notebook step.
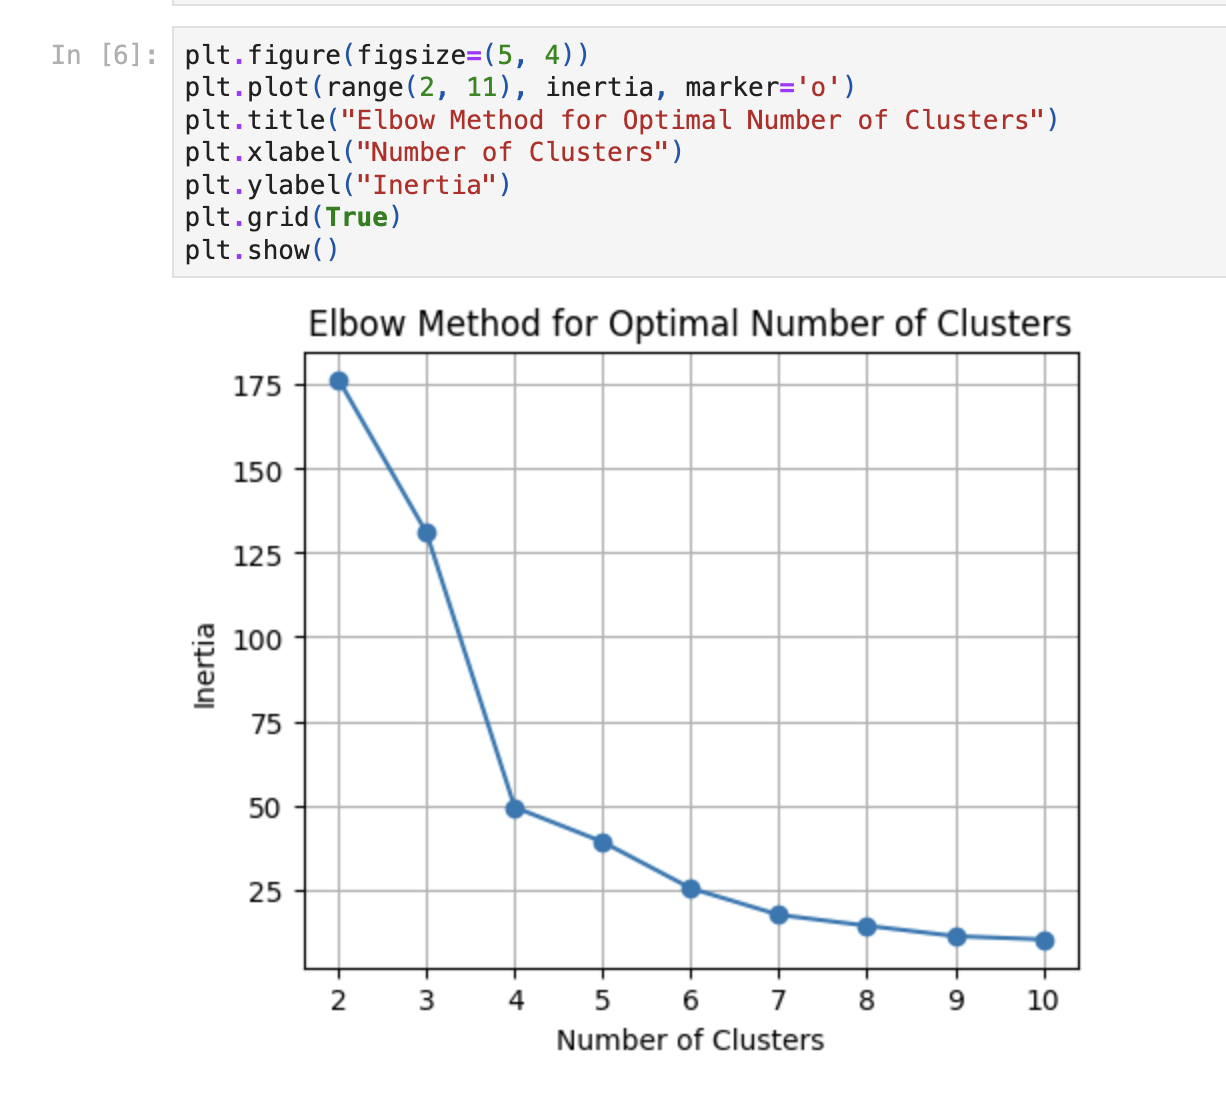
Magic!
Final thoughts
Thanks to David for organizing amazing Madrid events! Thanks again to the MeasureCamp community, thanks to everybody who presented and shared their cases and learnings. Thanks, Marcus - it’s always a pleasure to attend your sessions. And thanks, Pia - I am really looking forward to your next blog posts!
I hope it was somehow interesting, and please connect me on LinkedIn and give a try to the free GA4Dataform package.